
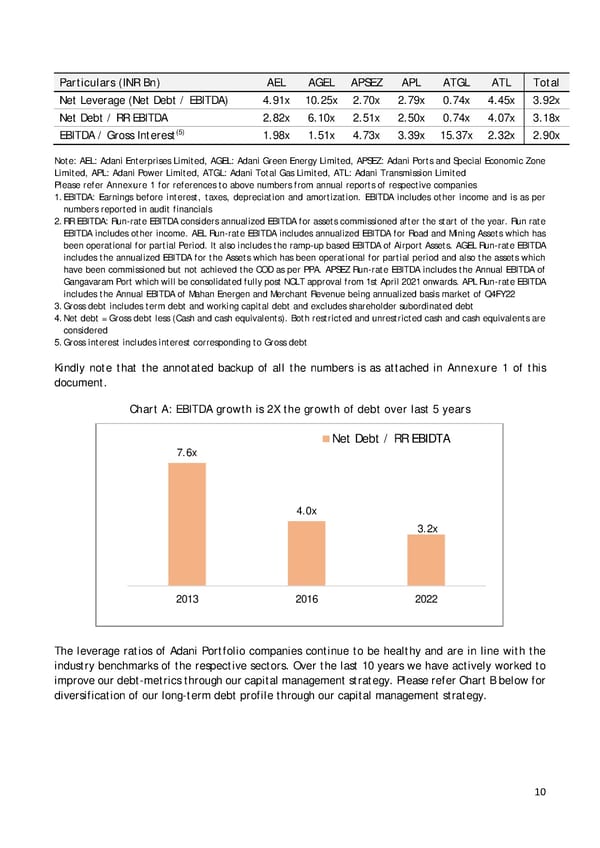
Particulars (INR Bn) AEL AGEL APSEZ APL ATGL ATL Total Net Leverage (Net Debt / EBITDA) 4.91x 10.25x 2.70x 2.79x 0.74x 4.45x 3.92x Net Debt / RR EBITDA 2.82x 6.10x 2.51x 2.50x 0.74x 4.07x 3.18x (5) EBITDA / Gross Interest 1.98x 1.51x 4.73x 3.39x 15.37x 2.32x 2.90x Note: AEL: Adani Enterprises Limited, AGEL: Adani Green Energy Limited, APSEZ: Adani Ports and Special Economic Zone Limited, APL: Adani Power Limited, ATGL: Adani Total Gas Limited, ATL: Adani Transmission Limited Please refer Annexure 1 for references to above numbers from annual reports of respective companies 1. EBITDA: Earnings before interest, taxes, depreciation and amortization. EBITDA includes other income and is as per numbers reported in audit financials 2. RR EBITDA: Run-rate EBITDA considers annualized EBITDA for assets commissioned after the start of the year. Run rate EBITDA includes other income. AEL Run-rate EBITDA includes annualized EBITDA for Road and Mining Assets which has been operational for partial Period. It also includes the ramp-up based EBITDA of Airport Assets. AGEL Run-rate EBITDA includes the annualized EBITDA for the Assets which has been operational for partial period and also the assets which have been commissioned but not achieved the COD as per PPA. APSEZ Run-rate EBITDA includes the Annual EBITDA of Gangavaram Port which will be consolidated fully post NCLT approval from 1st April 2021 onwards. APL Run-rate EBITDA includes the Annual EBITDA of Mahan Energen and Merchant Revenue being annualized basis market of Q4FY22 3. Gross debt includes term debt and working capital debt and excludes shareholder subordinated debt 4. Net debt = Gross debt less (Cash and cash equivalents). Both restricted and unrestricted cash and cash equivalents are considered 5. Gross interest includes interest corresponding to Gross debt Kindly note that the annotated backup of all the numbers is as attached in Annexure 1 of this document. Chart A: EBITDA growth is 2X the growth of debt over last 5 years Net Debt / RR EBIDTA 7.6x 4.0x 3.2x 2013 2016 2022 The leverage ratios of Adani Portfolio companies continue to be healthy and are in line with the industry benchmarks of the respective sectors. Over the last 10 years we have actively worked to improve our debt-metrics through our capital management strategy. Please refer Chart B below for diversification of our long-term debt profile through our capital management strategy. 10
 Adani Response Page 9 Page 11