
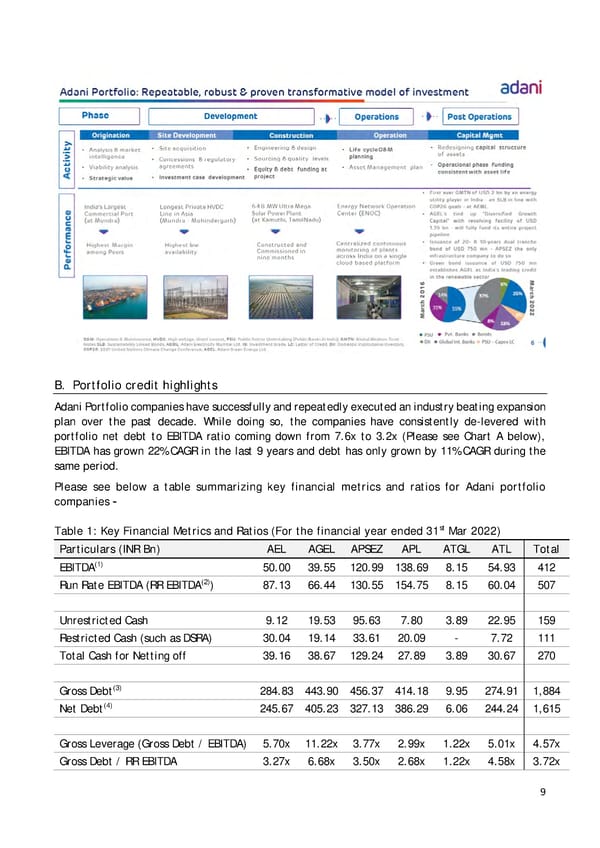
B. Portfolio credit highlights Adani Portfolio companies have successfully and repeatedly executed an industry beating expansion plan over the past decade. While doing so, the companies have consistently de-levered with portfolio net debt to EBITDA ratio coming down from 7.6x to 3.2x (Please see Chart A below), EBITDA has grown 22% CAGR in the last 9 years and debt has only grown by 11% CAGR during the same period. Please see below a table summarizing key financial metrics and ratios for Adani portfolio companies – Table 1: Key Financial Metrics and Ratios (For the financial year ended 31st Mar 2022) Particulars (INR Bn) AEL AGEL APSEZ APL ATGL ATL Total (1) EBITDA 50.00 39.55 120.99 138.69 8.15 54.93 412 (2) Run Rate EBITDA (RR EBITDA ) 87.13 66.44 130.55 154.75 8.15 60.04 507 Unrestricted Cash 9.12 19.53 95.63 7.80 3.89 22.95 159 Restricted Cash (such as DSRA) 30.04 19.14 33.61 20.09 - 7.72 111 Total Cash for Netting off 39.16 38.67 129.24 27.89 3.89 30.67 270 Gross Debt(3) 284.83 443.90 456.37 414.18 9.95 274.91 1,884 Net Debt(4) 245.67 405.23 327.13 386.29 6.06 244.24 1,615 Gross Leverage (Gross Debt / EBITDA) 5.70x 11.22x 3.77x 2.99x 1.22x 5.01x 4.57x Gross Debt / RR EBITDA 3.27x 6.68x 3.50x 2.68x 1.22x 4.58x 3.72x 9
 Adani Response Page 8 Page 10